EnergyNow News
We are Enserva. We are the voice of Canadian energy services, supply and manufacturing companies and its vital workforce.
For over 40 years we have championed and empowered Canadian energy. We never stop innovating and finding solutions to help Canadian energy thrive. We unlock the potential to find a better energy future for all. We make the world a better place by reducing energy poverty, increasing energy security, and creating economic growth and jobs.
We are the energy behind the energy.
Enserva is in Treaty 7, in Calgary, Alberta. In the spirit of building relationships, acknowledging truth & better honoring Treaty, we recognize that we gather and work on the traditional territories of the Blackfoot Confederacy (the Siksika, the Kainai, the Piikani), the Tsuut’ina, and the Îyâxe Nakoda Nations, as well as Métis Nation (Region 3). Our members, their operations, and the work of the association occurs throughout Canada. Enserva remains committed to playing our part in moving toward reconciliation.
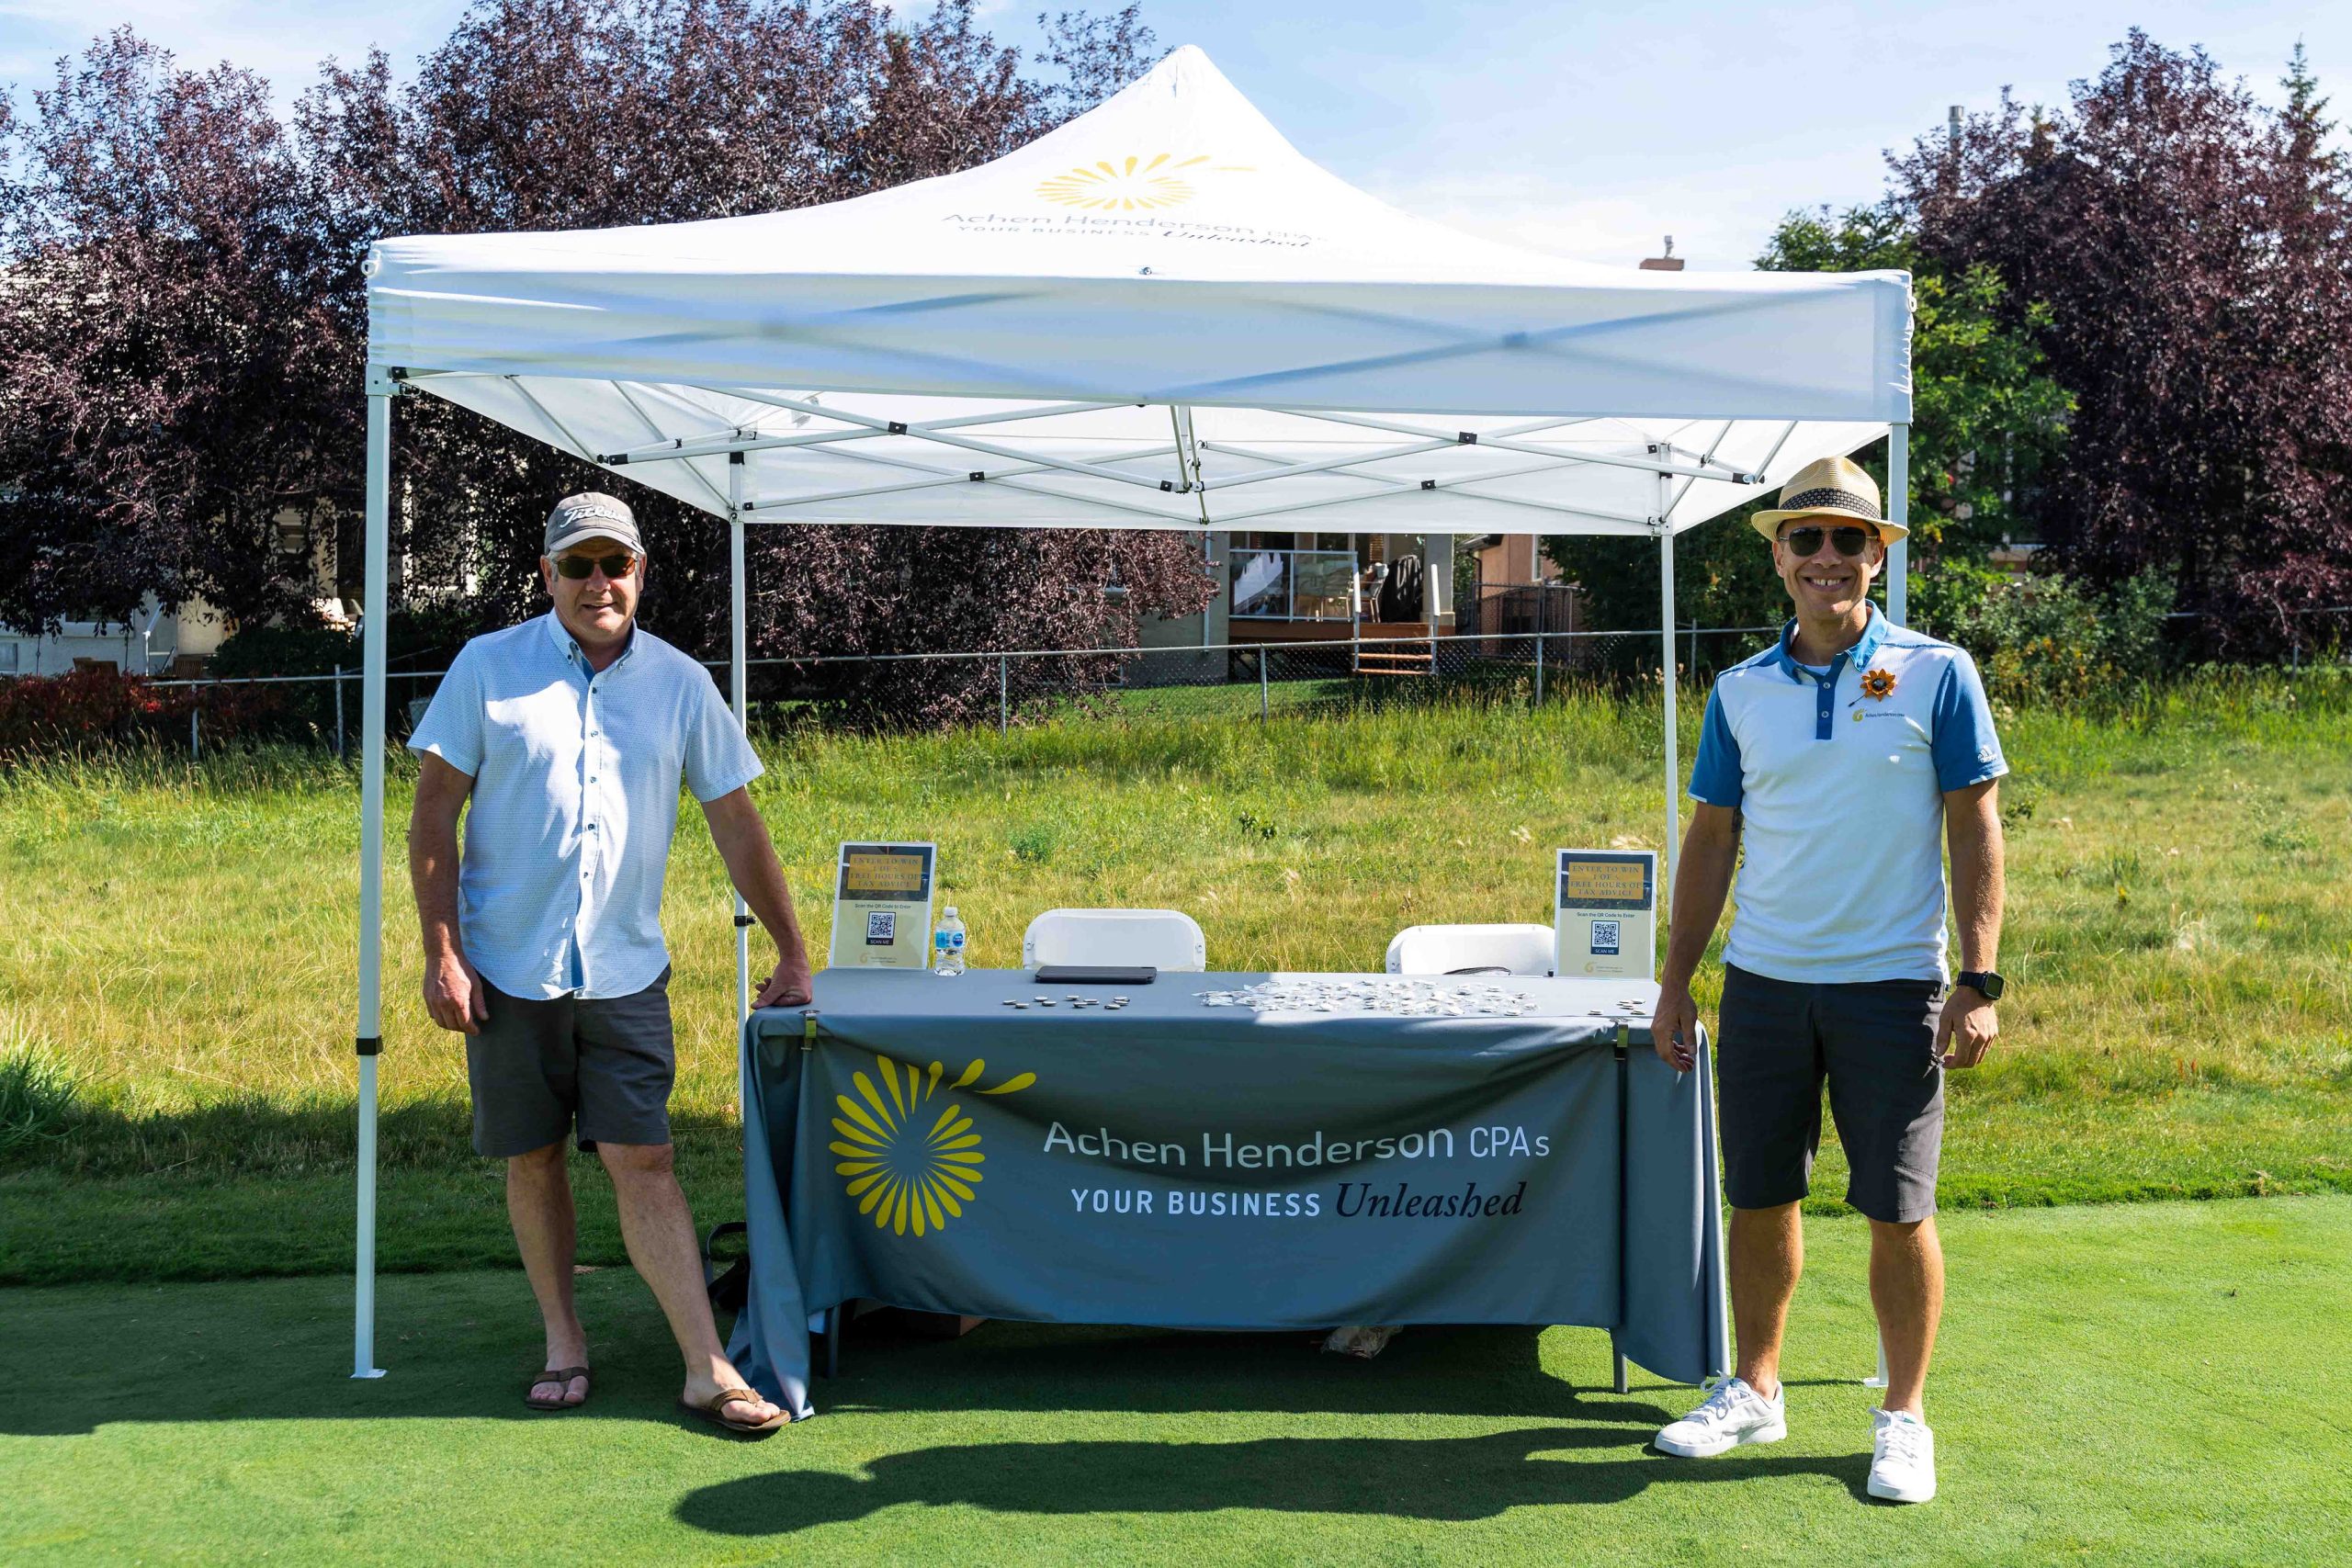
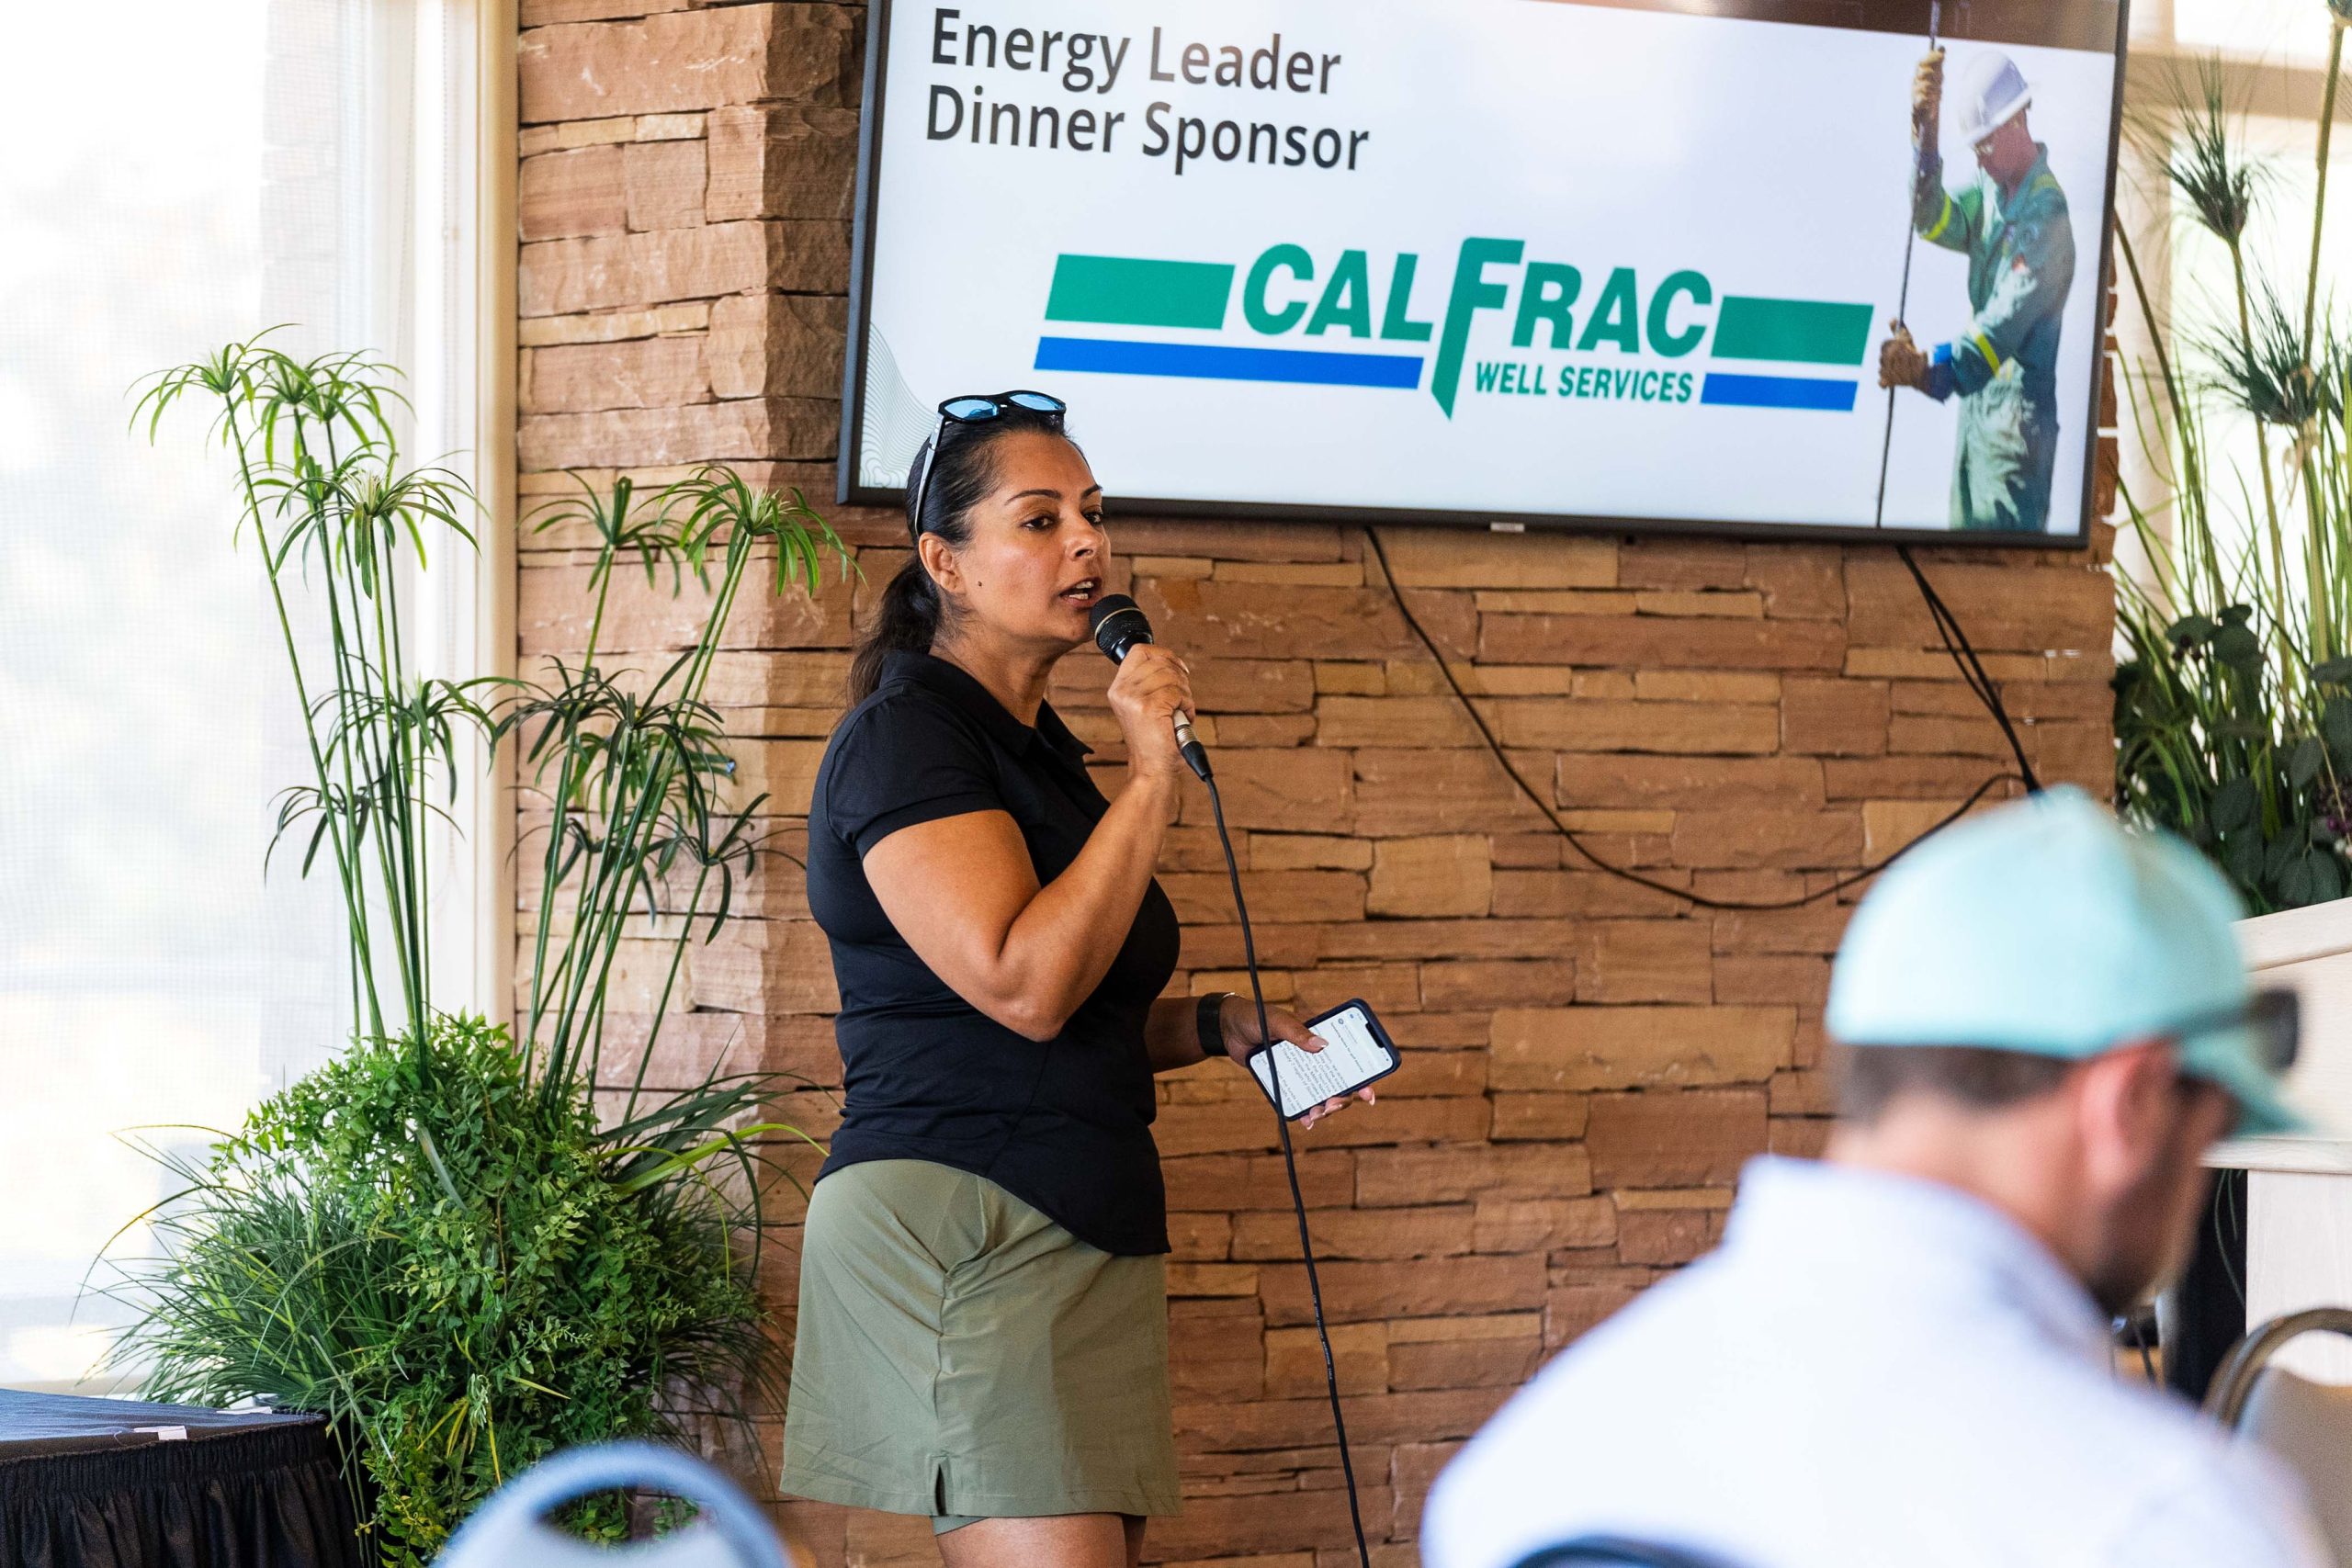
2024 Enserva Golf Classic
On September 16th, Enserva members will come together for our annual golf classic tournament at the Bearspaw Golf Club.
Keep an eye out for more details to come!

Unlocking Canadian energy to make the world a better place
We represent the energy sector’s innovators and solution-finders. We unlock Canadian energy by making connections, accessing resources, influencing policy and providing insights that accelerate the energy evolution. Our members provide the energy workforce that the world needs to thrive with the most responsible and carefully regulated practices in the world. They make the world a better place by reducing energy poverty, finding new ways to address impacts and creating economic growth and jobs.
Strategic pillars:
01
02
03